
What Is GIS (and Why It Matters Now)
Geospatial data has quietly become one of the most powerful drivers of digital transformation. From the apps that guide food deliveries to the algorithms that plan new 5G networks, location intelligence shapes nearly every modern service. Geographic Information Systems (GIS) sit at the core of this shift.
A GIS is much more than a map engine. It’s a system designed to capture, store, manage, analyze, and visualize spatial data. In other words, it gives geography analytical meaning. Organizations use GIS to detect patterns, forecast changes, and make decisions that would be impossible with flat spreadsheets.
The discipline has evolved dramatically over the last decade. What began as desktop cartography has become a connected ecosystem of cloud APIs, IoT sensors, and AI-driven analytics. A logistics company might now use real-time GIS data to optimize routes and cut emissions. A city might manage infrastructure and utilities through digital twins powered by geospatial systems.
The global market mirrors this momentum. GIS software revenue is expected to rise from $6.3 billion in 2020 to more than $25 billion by 2030. At Codeflyers, we see GIS as one of the defining interfaces between physical and digital reality – a bridge that turns location data into strategic insight.
Custom GIS vs. Off-the-Shelf: How to Choose
Every organization starts somewhere. Many teams begin with off-the-shelf platforms like Esri ArcGIS or the open-source QGIS. They’re proven, mature, and great for visualization. But as soon as your workflows depend on automation, integration, or scale, their limitations become visible.
Off-the-shelf software tends to lock users into predefined schemas and UI patterns. Integrating proprietary APIs or non-standard data sources often requires workarounds. If your goal is experimentation, speed, and seamless data flow across systems, custom GIS development becomes the smarter long-term path.
We usually advise building custom GIS when:
- You need real-time synchronization across multiple data sources (IoT sensors, telemetry, CRM, ERP).
- Your workflows demand domain-specific logic, such as telecom network modeling or environmental simulation.
- You plan to own and evolve the intellectual property.
- Security, compliance, or branding require full architectural control.
Our team at Codeflyers often uses a hybrid approach: combining trusted open-source cores (like GeoServer or PostGIS) with custom modules that deliver unique business logic. This keeps flexibility high while maintaining predictable cost.
GIS Building Blocks
GIS software brings together multiple technical layers – each one essential for reliability and precision.
Data formats.
Spatial data comes in several forms:
- GeoJSON for web-friendly vector data.
- Shapefile for legacy compatibility with Esri tools.
- KML for integration with Google-based systems.
- GeoTIFF for raster imagery.
Choosing the right format affects file size, performance, and how metadata (like projection or attributes) is preserved.
Spatial databases.
Traditional SQL engines can’t handle geographic operations efficiently. Instead, we rely on PostgreSQL + PostGIS, Oracle Spatial, or SpatiaLite – databases optimized for geometry types, spatial indexes, and topological queries. These systems can calculate distances, overlaps, and buffers directly in the database layer, reducing latency.
Platforms and tools.
ArcGIS, QGIS, and GRASS GIS offer visualization and analytical interfaces. They’re often used as data-authoring tools before data enters a custom web GIS stack. Our engineers frequently use QGIS in preprocessing pipelines to validate coordinate systems and topology before loading data into cloud storage.
Reference Architecture for Modern Web GIS
Modern GIS architecture follows a client–server pattern, with clear separation of concerns:
- Client: browser or mobile app rendering maps, handling interaction, and sending requests.
- Server: API layer for querying spatial data and performing computation.
- Data layer: spatial database, raster storage, and cache systems.
A typical Codeflyers architecture uses:
- REST or GraphQL APIs for communication.
- Cloud-native processing (AWS Lambda, Azure Functions) for scalable spatial analysis.
- Object storage (S3, Google Cloud Storage) for large rasters.
- CDNs like CloudFront for global tile distribution.
We also apply microservices for modularity — for instance, a geocoding service, a routing service, and a visualization service operating independently. In latency-sensitive projects, edge computing ensures computations like proximity searches happen close to users.
Finally, map rendering can use raster tiles (pre-rendered images) or vector tiles (data streamed and rendered on the client). Vector tiles allow smoother zooming and dynamic styling, while raster tiles remain ideal for satellite and terrain imagery.
Tech Stack at a Glance
The GIS stack spans multiple languages and frameworks, each optimized for a specific role.
Backend & processing.
Python dominates here. Libraries such as GDAL/OGR handle file conversions and coordinate transformations. Rasterio manages satellite imagery. GeoPandas brings pandas-style analytics to spatial data. For high-performance computation, we sometimes integrate C++ modules or Java-based engines for concurrency.
Frontend & visualization.
JavaScript frameworks form the presentation layer.
- Leaflet – lightweight and perfect for 2D web maps.
- OpenLayers – ideal for complex vector data and WMS/WFS integration.
- Mapbox GL JS – for high-end rendering with custom styling.
- CesiumJS – for immersive 3D environments and digital twins.
APIs & SDKs.
Most GIS projects combine custom data with third-party APIs:
- Google Maps API for geocoding, routing, and POI data.
- Mapbox API for vector tiles and 3D visualization.
- Esri ArcGIS REST API for enterprise GIS functions.
Visualization & analysis tools.
Client-side analytics are handled by Turf.js, while D3.js adds statistical graphics like heatmaps and choropleths. Together they turn maps into interactive dashboards, not static images.
Delivery Lifecycle: From Brief to Production
Delivering a robust GIS platform isn’t a one-step build — it’s a structured lifecycle.
At Codeflyers, we divide it into six iterative stages:
- Requirements discovery.
We start by defining goals: who uses the system, what data they need, and what decisions GIS should enable. Workshops uncover user stories, data sources, and integration points. - Architecture & design.
Our architects design a scalable system blueprint: data flow diagrams, API design, and storage strategies. Scalability and security are built in from the first sprint. - Development.
Backend teams build APIs and spatial logic; frontend teams craft intuitive map interfaces. Continuous integration keeps all modules synchronized. - Testing.
QA includes functional testing, spatial precision validation, load testing, and coordinate system accuracy checks. - Deployment.
Using infrastructure-as-code (Terraform, CloudFormation), we roll out cloud environments with automated CI/CD pipelines. - Maintenance & evolution.
Post-launch, we monitor performance, implement updates, and add features as data sources expand. GIS systems are living ecosystems – they evolve with every new dataset.
Integration Playbook
No GIS platform lives in isolation. Its value comes from how well it connects to the rest of the enterprise stack.
Common integrations include:
- IoT and telemetry. Feeding real-time location data from sensors or vehicles via MQTT or WebSockets.
- ERP & CRM. Synchronizing assets, customers, and service locations to visualize business operations geographically.
- Business intelligence tools. Embedding map widgets into dashboards such as Power BI or Tableau for spatial analytics.
- Mobile field apps. Delivering offline maps, geofencing alerts, and live tracking to mobile teams.
Integration also works the other way around. A GIS can expose its own APIs to share processed data – e.g., a “location intelligence service” used by other departments. The architecture must account for rate limiting, caching, and data versioning to keep everything consistent.
Performance & Scalability Essentials
Large-scale spatial data brings unique performance challenges. Maps can easily involve millions of geometries and terabytes of imagery.
Optimization strategies we use include:
- Tiling & caching. Pre-rendering tiles or caching query results drastically reduces load time.
- Spatial indexing. PostGIS and MongoDB GeoJSON use R-tree or quadtree indexes for faster queries.
- Clustering. Instead of rendering every point, nearby features are aggregated into clusters until zoomed in.
- Lazy loading. Data layers load only when required, preventing memory overload.
- Parallel processing. Large raster transformations are distributed across cloud functions.
We also track cost optimization. Efficient caching and compression can cut cloud bills by 30–40% on heavy-traffic systems.
Security in GIS Applications
Because GIS combines operational and sometimes personal data, security must be multilayered.
Access control.
Each user or API key should have scoped permissions – read, write, or admin – tied to specific datasets. OAuth2 and OpenID Connect handle authentication across services.
Encryption.
Data is encrypted both in transit (TLS 1.2+) and at rest. Sensitive coordinates (for example, critical infrastructure) may be tokenized.
API hygiene.
We monitor for abuse through rate limiting and anomaly detection. Audit logs record every map tile and query request.
Privacy.
For consumer-facing applications, location data can reveal personal habits. We anonymize trajectories and use spatial generalization to prevent identification while retaining analytical value.
Compliance, Data Governance & SLAs
Location data is subject to some of the world’s strictest privacy and security laws. Ignoring compliance can lead to reputational and financial damage.
Regulatory frameworks.
- GDPR (EU) and CCPA (US) regulate how user location data is collected, processed, and shared.
- ISO 27001 provides structure for information security management.
- Some regions impose additional rules on mapping sensitive areas or storing data abroad.
Data governance.
A mature GIS system defines ownership, validation, and retention policies for every dataset. Metadata standards such as ISO 19115 help maintain lineage and consistency.
Privacy-by-design.
We encourage building privacy into architecture: user consent prompts, aggregation thresholds, and data minimization by default.
SLAs & SLOs.
Enterprise GIS platforms often promise 99.9% uptime, low latency (< 500 ms per map tile), and scheduled data refreshes. Our team sets measurable objectives for availability and performance, backed by automated monitoring and alerting.
Industry Spotlight: Telecom
Few industries demonstrate GIS impact as clearly as telecommunications.
Network planning & rollout.
GIS helps identify optimal cell tower locations using population density, terrain, and interference models.
Fiber route optimization.
Routing algorithms consider elevation, land use, and infrastructure to find the least-cost path.
Real-time network monitoring.
Operators visualize outages, weak signals, and maintenance teams in one unified map interface.
Asset management & maintenance.
Every tower, cable, and antenna is georeferenced, enabling predictive maintenance and reducing downtime.
5G rollout.
Because 5G uses higher frequencies with shorter range, tower placement is far denser. GIS simulations model signal propagation and suggest ideal micro-cell layouts.
Our team has supported projects where GIS-driven automation cut rollout time by weeks and improved capital expenditure efficiency by double digits. Telecom may be the most visible example, but the same principles apply to energy grids, logistics networks, and urban mobility.
Costs & Timelines: What to Budget
Budgeting for GIS software depends on scope, features, and infrastructure choices.
Feature tiers:
- Basic GIS app ($10 000–$50 000) – map viewing, data layering, simple analytics.
- Mid-complexity ($50 000–$150 000) – user management, custom APIs, moderate real-time data.
- Advanced ($150 000+) – 3D rendering, machine learning, continuous data ingestion.
Hidden variables:
Data licensing, API usage fees, and compliance audits can add to total cost. Planning a Discovery Phase before development clarifies these factors early – a standard practice at Codeflyers to prevent scope drift.
Best Practices & Common Pitfalls
Best practices
- Maintain clean, validated datasets – garbage in, garbage out.
- Use version control (Git) and clear branching for data schemas.
- Automate ETL pipelines to ensure repeatability.
- Document coordinate systems and transformations explicitly.
Common pitfalls
- Ignoring projection mismatches between layers.
- Overloading maps with unclustered points.
- Building monolithic services that can’t scale.
- Underestimating data privacy obligations.
Each project we deliver adds refinements to this list. Our engineers treat GIS as a living discipline – one where lessons from every deployment feed into the next.
Mini Case Snapshots
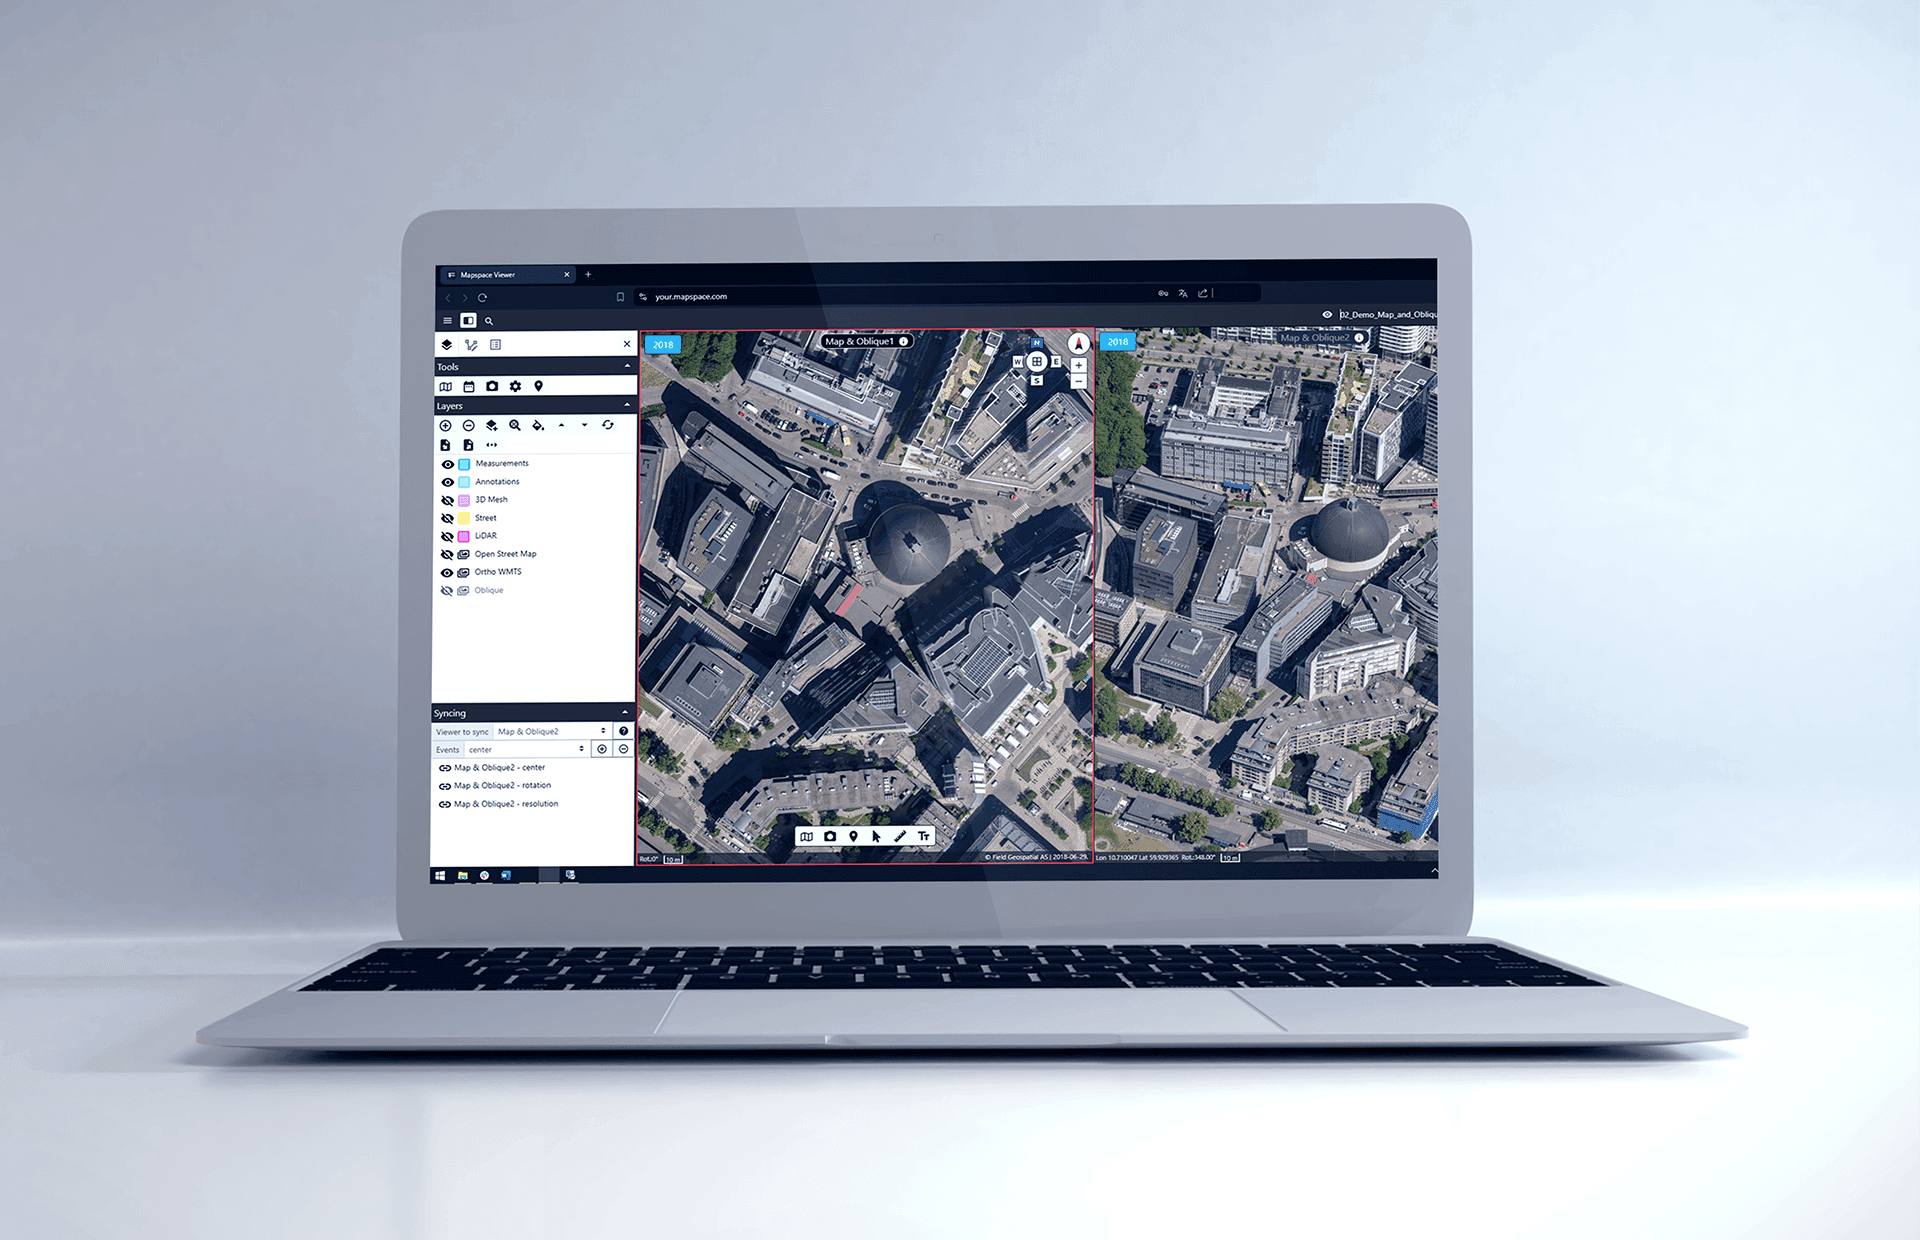
Mapspace: From Legacy Fragility to Enterprise-Grade Performance
Client: Field Group
Sector: Infrastructure, Construction, Environment, Public Sector
Mapspace began as a promising GIS platform for enterprise users but had become weighed down by technical debt and outdated architecture. Performance lagged, rendering slowed under real-world data, and the backlog grew unmanageable. Incremental fixes were no longer an option — the system needed structural reinvention.
Our team at Codeflyers led a full rebuild focused on scalability, real-time rendering, and long-term velocity. We engineered a new architecture based on Java, GDAL, OpenLayers, Three.js, and Cesium, designed for high-volume spatial datasets and responsive 2D/3D visualization. Using LOD tiling, we ensured fast interaction even with gigabyte-scale maps.
The result was a complete transformation: a modern, modular platform capable of handling enterprise workloads with speed and precision. Rendering performance improved dramatically, development cycles became agile and measurable, and the client regained full control over the product roadmap. Mapspace moved from technical fragility to category leadership – a platform now ready for global-scale geospatial operations.
Code2Blur: AI-Powered Privacy Protection for Geospatial Data
Client: Field Group
Sector: Geospatial Intelligence, Data Compliance
Handling panoramic imagery up to 20,000 × 10,000 pixels under GDPR constraints, Field Group faced a critical challenge: anonymizing faces, vehicles, and license plates across vast datasets. Their legacy GPU workflow was manual, error-prone, and non-compliant — threatening both SLAs and regulatory trust.
We designed and deployed Code2Blur, an AI-driven anonymization engine built with PyTorch, C++, OpenCV, and TensorRT, fully integrated into their ETL pipeline. The system uses advanced models like YOLOv8, Mask R-CNN, and Segment Anything to detect and obscure sensitive elements automatically. Deployed as a Dockerized microservice, it delivers real-time processing and audit-grade traceability.
In six weeks, Code2Blur reduced processing time by 66%, eliminated manual reviews entirely, and ensured 100% GDPR compliance with versioned logs. Beyond technical gains, it became a strategic differentiator — enabling Field Group to win regulated contracts, scale across EU markets, and turn compliance into competitive leverage.
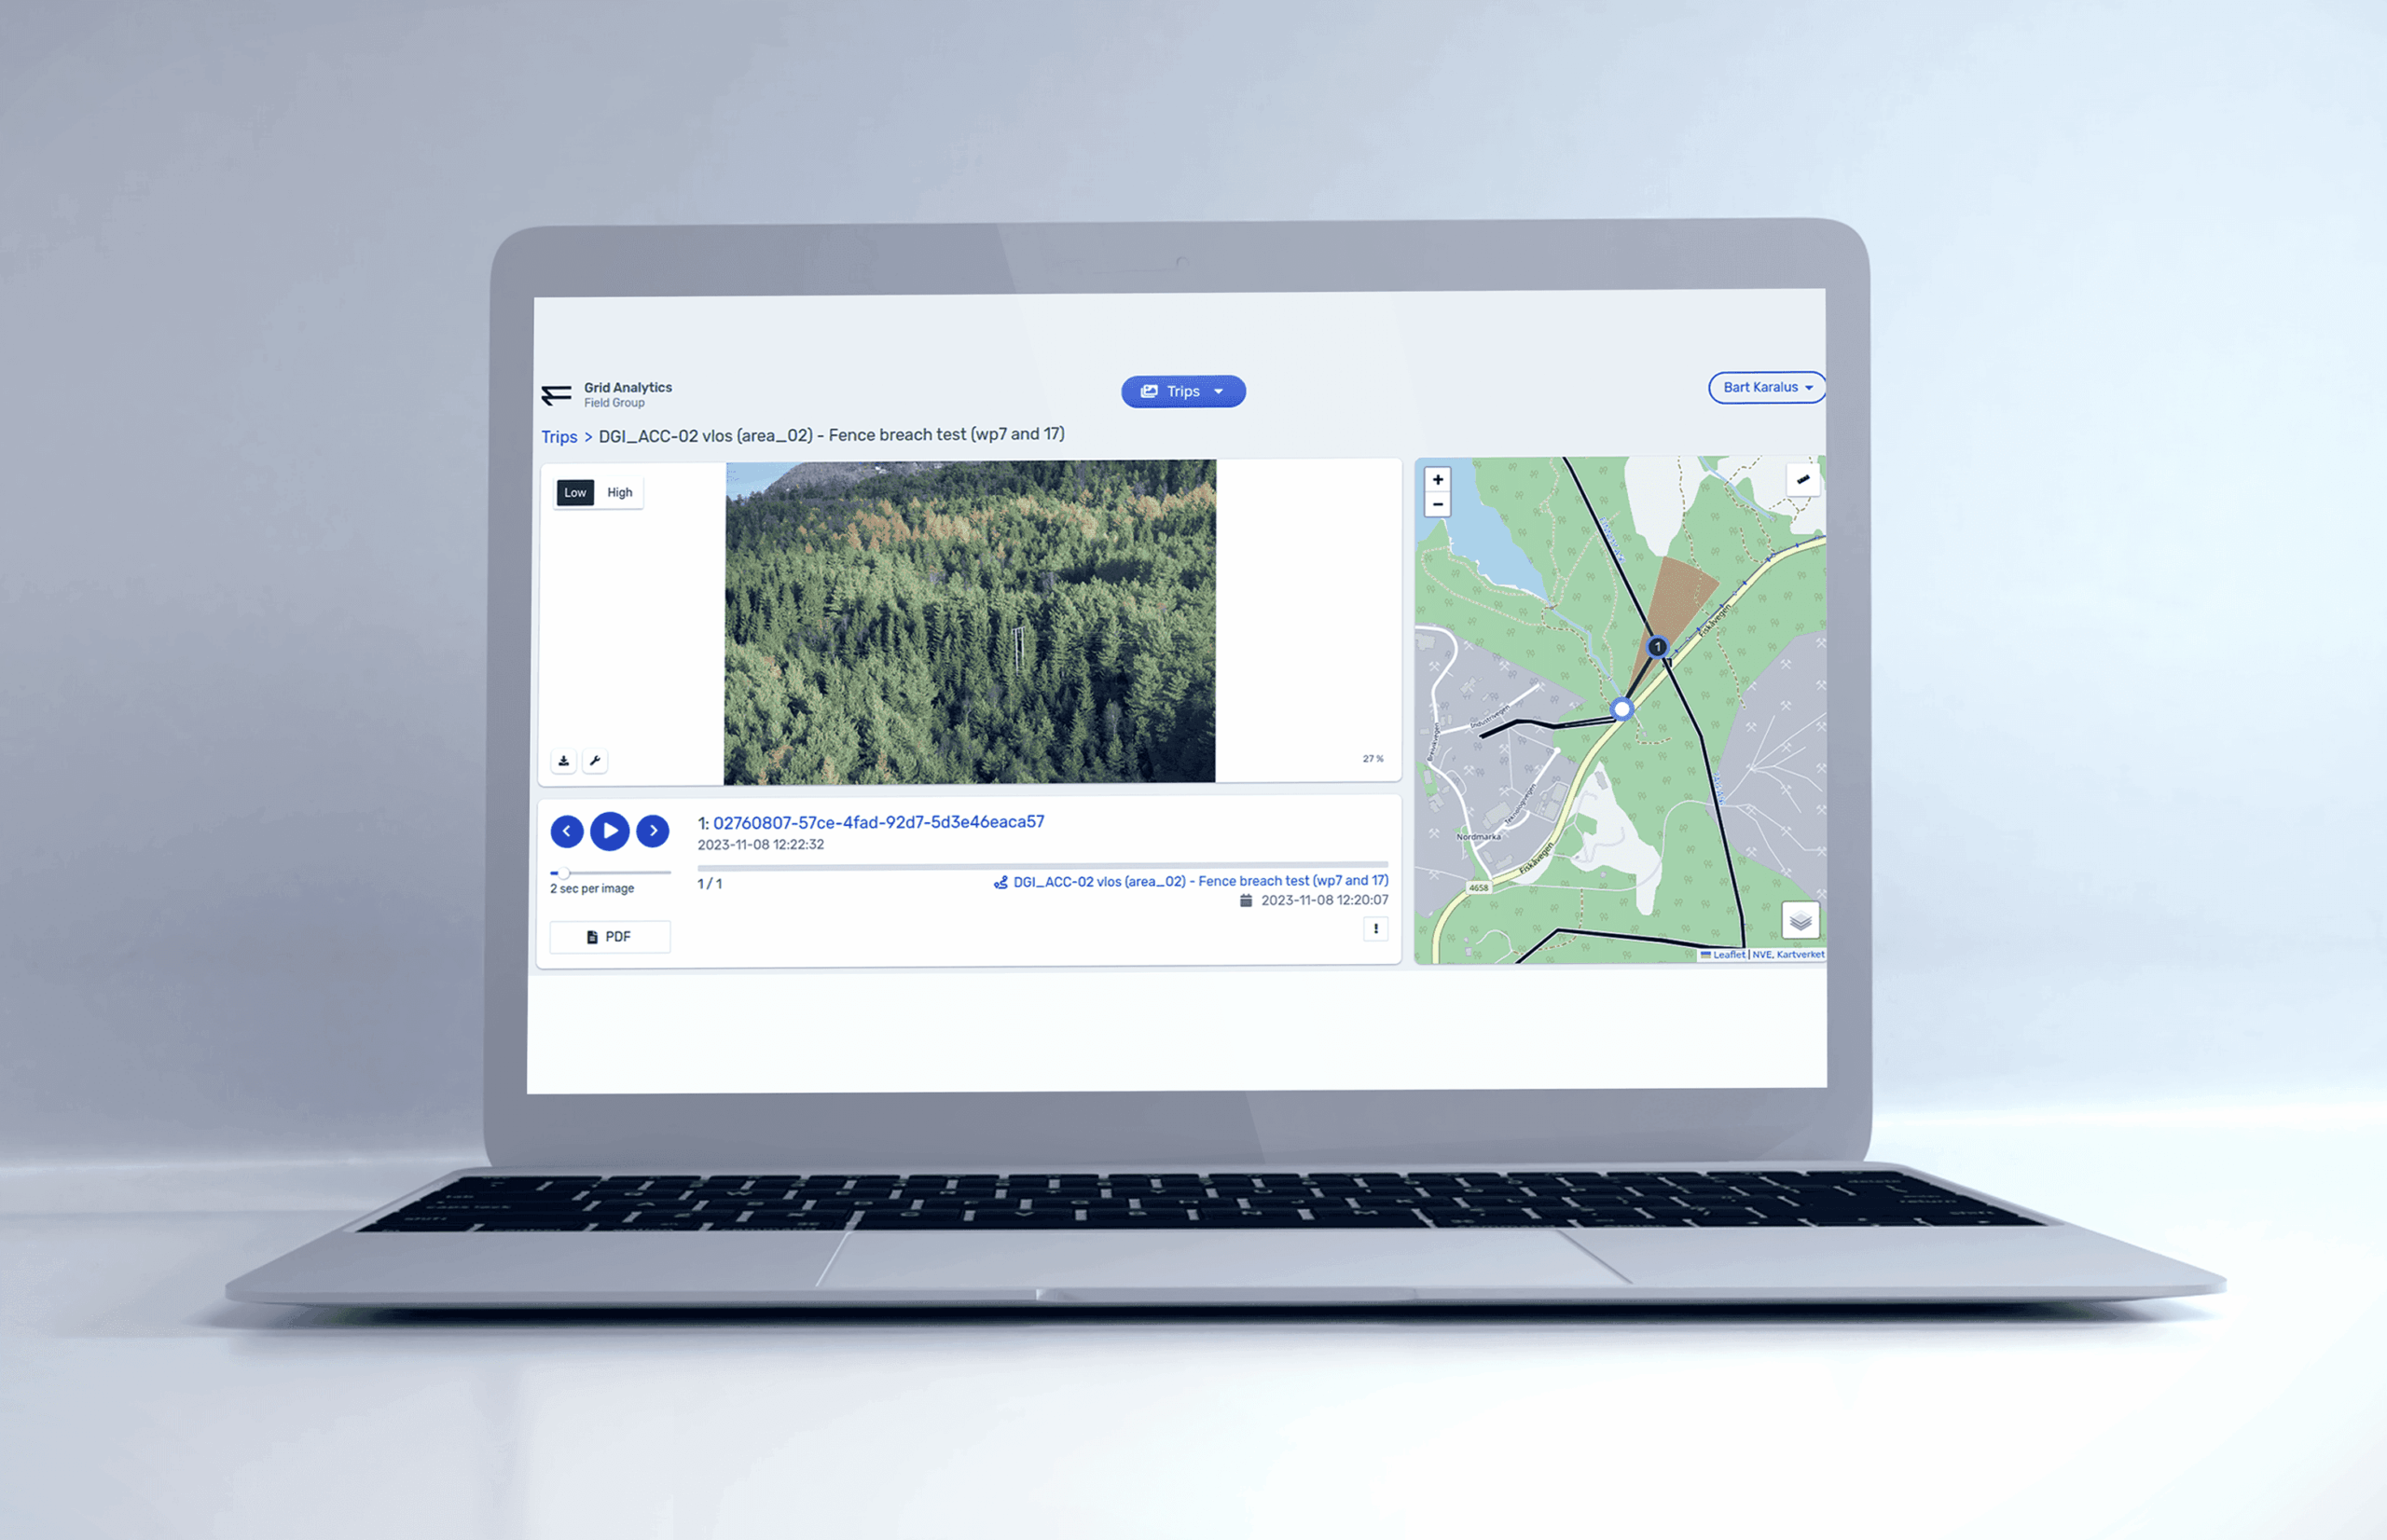
Grid Analytic: Scalable Infrastructure Intelligence for Global Expansion
Client: Field Group
Sector: Infrastructure Monitoring, Energy, Utilities
Field Group needed a scalable inspection and analytics platform capable of fusing LiDAR and visual data for large-scale infrastructure monitoring. Their legacy system couldn’t support real-time data ingestion, global access, or automated insight delivery.
Our engineers rebuilt Grid Analytics from the ground up on a cloud-native architecture spanning GCP and Azure, with Vue.js and Mapbox powering a responsive visualization layer. The backend, based on MongoDB and elastic compute, enables parallel project processing, while AI/ML models automatically detect vegetation and asset defects from drone imagery.
The re-engineered platform achieved 99% uptime, tripled data throughput, and enabled 2–3 TB of drone-derived data to be processed weekly. Grid Analytics is now a commercial-ready, white-label product supporting global clients — transforming Field Group’s inspection workflows from reactive analysis to proactive infrastructure intelligence.
Each case underscores how GIS becomes a strategic multiplier when combined with automation and AI.
Next Steps
Launching a GIS initiative starts with clarity – not code.
Discovery checklist:
- Define the business decisions your GIS must enable.
- Identify data sources and ownership (internal, public, third-party).
- Specify data freshness and accuracy requirements.
- Outline integration points with other systems.
- Choose a small, measurable proof of concept to validate assumptions.
From there, expand iteratively. The best GIS systems are built like good maps — layer by layer, with precision and intent.
Final Thoughts
GIS software development blends geography, data science, and engineering into one connected discipline. It helps organizations understand not just where things are, but why they happen there.
At Codeflyers, we believe every dataset hides a geography – a pattern waiting to be revealed. By combining scalable architecture, intelligent analytics, and thoughtful design, our team turns complex spatial information into tools that guide smarter decisions and more resilient infrastructure.
GIS isn’t just about maps. It’s about understanding the world – and building technology that helps us navigate it better.